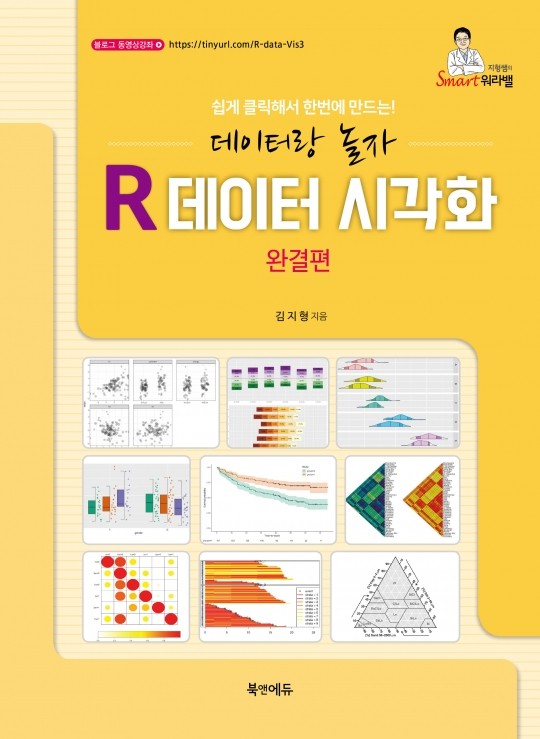
PART 1. 일러두기
1-1. 사용법
1-2. 개선점과 아쉬운 점
1-3. CSV 파일로 저장하기
1-4. 연결되지 않을 때
PART 2. 발전된 plot
2-1. Weighted Scatter plot
2-2. Likert Chart(III)
2-3. Band Densitogram
2-4. BoxJitter Plot
2-5. Crosshairs Plot
2-6. Dense scatter plot
2-7. Basic Plots variations
2-8. Double BoxPlot
2-9. Venn diagram(II)
2-10. Mosaic Plots
2-11. Voronoi Treemap
2-12. Many Pies
2-13. Parallel Coordinate Plot(III)
2-14. Mountain Plot
2-15. Castles Plot
2-16. Combination Count Plot
2-17. Trend line
PART 3. 시간과 관련된 차트
3-1. Bump Plot
3-2. Flow bump plot
3-3. Alluvial Diagrams(II)
3-4. Cloud errorbar Plot
3-5. Peak Valley Plot
3-6. Spaghetti Plot(III)
3-7. Muller Plot(I)
3-8. Muller Plot(II)
3-9. Moon Plot
3-10. Epicurve(II)
3-11. Epicurve(III)
3-12. Calendar Plot(III)
3-13. Time Series Analysis
3-14. Similar Time Series
3-15. Diagram for Epidemic Model
PART 4. 지도
4-1. Colored World Map
4-2. Box Map
4-3. Map with multi-nations
4-4. Continent Map
4-5. Globe
4-6. Honeycomb Globe
4-7. US Map
4-8. US Bubble Map
4-9. USA Tile Map
4-10. US states table map
4-11. Geotracer
PART 5. 유전 연구
5-1. Pedigrees for a Disease
5-2. Tagged Peptides Plot
5-3. GGE Biplots
5-4. multiple Sequence Plot
5-5. Genotype Plot
5-6. Genealogical Plot
5-7. Circular Manhattan Plot
5-8. Volcano Plot
5-9. Regional Association Plot in Gene
5-10. forest plot in Genetics
5-11. correlation of two gene
5-12. Chromosome Linkage Plot
5-13. Chromosome Density Plot
5-14. Gene Arrow Maps
5-15. RNA Secondary Structure
PART 6. 기상 연구
6-1. Quiver Wind Plot
6-2. skew-T-diagram
6-3. Meteorological Plot
PART 7. 통계와 차트
7-1. Statistics & distribution
7-2. Outliers (O3) Plot
7-3. Bland-Altman plots
7-4. Compare Two Measurement
7-5. Reliability Plot
7-6. Matrix Overlap plot
7-7. Distogram
7-8. Dandelion Plot
7-9. Kaplan-Meier Plot & Table
7-10. Event Plot in longitudinal data
7-11. Tendril Plot
7-12. Plot for PCA
7-13. Pretty partykit Tree
7-14. Forest plot of subgroups
7-15. Subgroup Anal Plot
7-16. post-hoc and grouping
7-17. Survival Group
7-18. Ecotoxicology Plot
7-19. Variable Importance Plot
PART 8. 색 관련 plot
8-1. Color Palettes Plot
8-2. Gradation Plot
8-3. Find named Colors
8-4. Find near Colors
PART 9. 재미있는 plot
9-1. Text-based plot
9-2. Cartoon Plot
9-3. R man
9-4. Lucky Plot
9-5. Growing bar Plot
9-6. Moving bar Plot
9-7. Moving bubble Plot
9-8. Moving scatter Plot
9-9. Growing Pyramid
9-10. Guitar Chords
9-11. Aim Plot
9-12. Parliament Plot
9-13. Texture Triangle


